For customers coming from OpenShift 3, one thing that gets noticed right away is the change in consoles. While the Administrator perspective is analgous to the cluster console in 3.11, what happened to the default console which was the bread and butter experience for developers?
The good news is that in OpenShift 4 there is a new Developer perspective which provides an alternative experience tailored specifically for Developers out of a unified console. The Developer perspective features include providing a topology view giving an at-a-glance overview of applications in the namespace as well as the ability to quickly add new applications from a variety of sources such as git, container images, templates, helm charts, operators and more.
In this blog we will examine some of these new features and discuss how you can get the most out of the capabilities available in the Developer perspective. While the OpenShift documentation does cover many of these and I will link to the docs when needed, I think it’s worthwhile to review them in a concise form in order to understand the art of the possible with respect to empowering Developers in the OpenShift console.
Many of these features can be accessed by regular users, however some do require cluster-admin rights to use and are intended for a cluster administrator to provision on behalf of their developer community. Cluster administrators can choose the features that make sense for their developers providing an optimal experience based on their organizations requirements.
Labels and Annotations in the Topology View
The topology view provides an overview of the application, it enables users to understand the composition of the application at a glance by depicting the component resource object (Deployment, DeploymentConfig, StatefulSet, etc), component health, the runtime used, relationships to other resources and more.
The OpenShift Documentation on topology goes into great detail on this view however it focuses on using it from a GUI perspective and only mentions anecdotally at the end how how it is powered. Thus I would like to cover this in more detail since in many cases our manifests are stored and managed in git repos rather then in the console itself.
In short, how the topology view is rendered is determined by the labels and annotations on your resource objects. The labels and annotations that are available are defined in this git repo here. These annotations and labels, which are applied to the three Deployments, DeployConfigs, etc, are a mix of recommended kubernetes labels (https://kubernetes.io/docs/concepts/overview/working-with-objects/common-labels) as well as new OpenShift recommended labels and annotations to drive the topology view.
An example of these labels and annotations can be seen in the following diagram:

using this image as an example, we can see the client component is using the Node.js runtime and makes calls to the server component. The metadata for the client Deployment that causes this to be rendered in this way is as follows:
metadata:
  name: client
  annotations:
    app.openshift.io/connects-to: server
    app.openshift.io/vcs-ref: master
    app.openshift.io/vcs-uri: 'https://github.com/gnunn-gitops/product-catalog-client'
  labels:
    app: client
    app.kubernetes.io/name: client
    app.kubernetes.io/component: frontend
    app.kubernetes.io/instance: client
    app.openshift.io/runtime: nodejs
    app.kubernetes.io/part-of: product-catalog
The key labels and annotations that are being used in this example are as follows:
| Type |
Name |
Description |
| Label |
app.kubernetes.io/part-of |
This refers to the overall application that this component is a part-of. In the image above, this is the ‘product-catalog’ bounding box which encapsulates the database, client and server components |
| Label |
app.kubernetes.io/name |
This is the name of the component, in the image above it corresponds to “database”, “server” and “client” |
| Label |
app.kubernetes.io/component |
The role of the component, i.e. frontend, backend, database, etc |
| Label |
app.kubernetes.io/instance |
This refers to the instance of the component, in the above simple example I have set the instance to be the same as the name but that’s not required. The instance label is used by the connect-to annotation to render the line arrows to depict the relationship between different components. |
| Label |
app.openshift.io/runtime |
This is the runtime used by the component, i.e. Java, NodeJS, Quarkus, etc. The topology view uses this to render the icon. A list of icons that are available in OpenShift can be found in github in the OpenShift console repo in the catalog-item-icon.tsx file. Note that you should select the branch that matches your OpenShift version, i.e. the “release-4.5” branch for OCP 4.5.
|
| Annotation |
app.openshift.io/connects-to |
Renders the directional line showing the relationship between components. This is set to the instance label of the component for which you want to show the relationship. |
| Annotation |
app.openshift.io/vcs-uri |
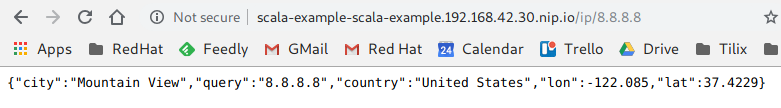
This is the git repo where the source code for the application is located. By default this will add a link to the circle that can be clicked to navigate to the git repo. However if CodeReady Workspaces is installed (included for free in OpenShift), this will create a link to CRW to open the code in a workspace. If the git repo has a devfile.yaml in the root of the repository, the devfile will be used to create the workspace.
The example image above shows the link to CRW in the bottom right corner. |
| Annotation |
app.openshift.io/vcs-ref |
This is the reference to the version of source code used for the component. It can be a branch, tag or commit SHA. |
A complete list of all of the labels and annotations can be found here.
Pinning Common Searches
In the Developer perspective the view is deliberately simplified from the Administrator perspective to focus specifically on the needs of the Developer. However predicting those needs is always difficult and as a result it’s not uncommon for users to need to find additional Resources.
To enable this, the Developer perspective provides the Search capability which enables you to find any Resource in OpenShift quickly and easily. As per the image below, highlighted in red, it also has a feature tucked away in the upper right side called “Add to Navigation”, if you click that your search gets added to the menubar on the left.

This is great for items you may commonly look for, instead of having to repeat the search over and over you can just bookmark it into the UI. Essentially once you click that button, the search, in this case for Persistent Volume Claims, will appear in the bar on the left as per below.

CodeReady Workspaces
CodeReady Workspaces (CRW) is included in OpenShift and it provides an IDE in a browser, I typically describe it as “Visual Studio Code on the web”. While it’s easy to install, the installation is done via an operator so it does require a cluster administrator to make it available.
The real power of CRW in my opinion is the ability to have the complete stack with all of the tools and technologies needed to work effectively on the application. No longer does the developer need to spend days setting up his laptop, instead simply create a devfile.yaml in the root of your git repository and it will configure CRW to use the stack appropriate for the application. Clicking on the CodeReady Workspaces icon in the Developer Topology view will open up a workspace with everything ready to go based on the devfile.yaml in the repo.
In short, one click takes you from this:

To this:

In my consulting days setting up my workstation for the application I was working on was often the bane of my existence involving following some hand-written and often outdated instructions, this would have made my life so much easier.
Now it should noted that running an IDE in OpenShift does require additional compute resources on the cluster, however personally I feel the benefits of this tool make it a worthwhile trade-off.
The OpenShift documentation does a great job of covering this feature so have a look there for detailed information.
Adding your own Helm Charts
In OpenShift 4.6 a new feature has been added which permits you to add your organization’s Helm Charts to the developer console through the use of the HelmChartRepository object. This enables developers using the platform to access the Helm Chart through the Developer Console and quickly instantiate the chart using a GUI driven approach.
Unfortunately, unlike OpenShift templates which can be added to the cluster globally or to specific namespaces, the HelmChartRepository object is cluster scoped only and does require a cluster administrator to use. As a result this feature is currently intended to be used by the cluster administrators to provide a curated set of helm charts for the platform user base as a whole.
An example HelmChartRepository is shown below:
apiVersion: helm.openshift.io/v1beta1
kind: HelmChartRepository
metadata:
  name: demo-helm-charts
spec:
  connectionConfig:
    url: 'https://gnunn-gitops.github.io/helm-charts'
  name: Demo Helm Charts
When this is added to an OpenShift cluster, the single chart in that repo, Product Catalog, appears in the Developer Console as per below and can be instantiated by developers as needed. The console will automatically display the latest version of that chart.

If you add a json schema (values.schema.json) to your Helm chart, as per this example, the OpenShift console can render a form in the GUI for users to fill out without having to directly deal with yaml.

If you are looking for a tutorial on how to create a Helm repo, I found the one here, “Create a public Helm chart repository with GitHub Pages”, quite good.
Adding Links to the Console
In many organizations it’s quite common to have a broad eco-system surrounding your own OpenShift cluster such as wikis, enterprise registries, third-party tools, etc to support your platform users. The OpenShift console enables a cluster administrator to add additional links to the console in various parts of the user interface to make it easy for your users to discover and navigate to the additional information and tools.
The available locations for ConsoleLink include:
- ApplicationMenu – Places the item in the application menu as per the image below. In this image we have custom ConsoleLink items for ArgoCD (GitOps tool) and Quay (Enterprise Registry).

- HelpMenu – Places the item in the OpenShift help menu (aka the question mark). In the image below we have a ConsoleLink that takes us to the ArgoCD documentation.

- UserMenu – Inserts the link into the User menu which is in the top right hand side of the OpenShift console.
- NamespaceDashboard – Inserts the link into the Project dashboard for the selected namespaces.
A great blog entry that covered console links, as well as other console customizations, can be found on the OpenShift Blog.
Web Terminal

This one is a little more bleeding edge as this is currently in Technical Preview, however a newer feature in OpenShift is the ability to integrate a web terminal into the OpenShift console. This enables developers to bring up a CLI whenever they need it without having to have the oc binary on hand. The terminal is automatically logged into OpenShift using the same user that is in the console.

The Web Terminal installs as an operator into the OpenShift cluster so again requiring a cluster admin to install it. Creating an instance of the web terminal once the operator is installed is easily done through the use of a CR:
apiVersion: workspace.devfile.io/v1alpha1
kind: DevWorkspace
metadata:
  name: web-terminal
  labels:
    console.openshift.io/terminal: 'true'
  annotations:
    controller.devfile.io/restricted-access: 'true'
  namespace: openshift-operators
spec:
  routingClass: web-terminal
  started: true
  template:
    components:
      - plugin:
          id: redhat-developer/web-terminal/4.5.0
          name: web-terminal
While this is Technical Preview and not recommended for Production usage, it is something to keep an eye on as it moves towards GA.