Using OpenShift Monitoring Alerts with External Secrets

In this blog we will see how to integrate the External Secrets operator with OpenShift monitoring so alerts are generated when ExternalSecret resources fail to be synchronized. This will be a short blog, just the facts ma’am!

To start with you need to enable the user monitoring stack in OpenShift and configure the platform alertmanager to work with user alerts. In the openshift-monitoring namespace there is a configmap called cluster-monitoring-config, configure it so it includes the fields below:

apiVersion: v1
kind: ConfigMap
metadata:
  name: cluster-monitoring-config
  namespace: openshift-monitoring
data:
  config.yaml: |
    enableUserWorkload: true
    alertmanagerMain:
      enableUserAlertmanagerConfig: true

Once you have done that, we need to deploy some PodMonitor resources so that the user monitoring Prometheus instance in OpenShift will collect the metrics we need. Note these need to be in the same namespace as where the External Secrets operator is installed, in my case that is external-secrets.

apiVersion: monitoring.coreos.com/v1
kind: PodMonitor
metadata:
  name: external-secrets-controller
  namespace: external-secrets
  labels:
    app.kubernetes.io/name: external-secrets-cert-controller
spec:
  selector:
    matchLabels:
      app.kubernetes.io/name: external-secrets-cert-controller
  podMetricsEndpoints:
  - port: metrics
---
apiVersion: monitoring.coreos.com/v1
kind: PodMonitor
metadata:
  name: external-secrets
  namespace: external-secrets
  labels:
    app.kubernetes.io/name: external-secrets
spec:
  selector:
    matchLabels:
      app.kubernetes.io/name: external-secrets
  podMetricsEndpoints:
  - port: metrics

Finally we add a PrometheusRule defining our alert, I am using a severity of warning but feel free to adjust it for what makes sense for your use case.

apiVersion: monitoring.coreos.com/v1
kind: PrometheusRule
metadata:
  name: external-secrets
  namespace: external-secrets
spec:
  groups:
  - name: ExternalSecrets
    rules:
    - alert: ExternalSecretSyncError
      annotations:
        description: |-
          The external secret {{ $labels.exported_namespace }}/{{ $labels.name }} failed to synced.
          Use this command to check the status:
          oc get externalsecret {{ $labels.name }} -n {{ $labels.exported_namespace }}
        summary: External secret failed to sync
      labels:
        severity: warning
      expr: externalsecret_status_condition{status="False"} == 1
      for: 5m

If you have done this correctly and have an External Secret in a bad state, you should see the alert appear. Note that by default in the console the platform filter is enabled so you will need to disable it, i.e. turn this off:

Platform Filter

And then you should see the alert appear as follows:

External Secret Alert

This alert will be routed just like all the other alerts so if you have destinations configured for email, slack, etc the alert will appear in those as well. Here is the alert in my personal Slack instance I use for monitoring my homelab:

Slack Alert

That’s how easy it is to get going, easy-peasy!

Homelab Fun and Games

Homepage

I made a recent post on Linkedin about the benefits of operating a homelab as if you were an enterprise with separate teams, in my case platform and application teams. There were a number of comments on the post asking for more information on my homelab setup so in this post let’s dig into it.

Background

I started my Homelab simply with a single machine running a Single-Node OpenShift (SNO) cluster. This machine had a Ryzen 3900x with 128 GB of RAM and has since been upgraded to a 5950x. It also doubled (and still does) as my gaming machine and I dual boot between OpenShift and Windows, this made it easier to justify the initial cost of the machine since I was getting more use out of it then I would have with a dedicated server.

Note I made a conscious decision to go with consumer level hardware rather than enterprise gear, I wanted to focus more on OpenShift and did not want to get into complex network management or racked equipment. My house does not have a basement so the only place I have for equipment is my home office and rack servers tend to be on the loud side. I’ve also opted to use a consumer grade router and separate network switch to run a 2.5G ethernet network in my home office versus a full blown 10G network with a managed switch, pfsense, etc.

I originally started with libvirt and three OpenShift nodes running as KVM VMs on my single server however this was using a lot of resources for the control plane. Once OpenShift SNO fully supported upgrades I switched over to a single SNO bare metal installation which was more performant and allowed for better utilization of resources. The only downside with SNO is I cannot run any workloads that explicitly requires three nodes but fortunately nothing I needed had that requirement.

This was my setup for a couple of years however a colleague with a similar setup had been running a second server to act as a hub cluster (i.e. Red Hat Advanced Cluster Manager and Red Hat Advance Cluster Security) and I decided to follow suit. I ended up buying a used Dell 7820 workstation earlier this year with dual Xeon 5118 processors off of eBay and then expanded its memory to 160 GB. As I joke with my wife though, one purchase always begets a second purchase…

This second purchase was triggered by the fact that with two servers I could no longer expose both OpenShift clusters to the Internet using simple port forwarding in my Asus Router given the clusters are running off the same ports (80, 443 and 6443). I needed a reverse proxy (HAProxy, NGINX, etc) to be able to do this and thus a third machine I could run it on. My two OpenShift cluster machines are started and stopped each day to save on power costs, however this third machine needed to run 24/7 so I wanted something efficient.

I ended up buying a Beelink SER 6 off of Amazon on one of the many sales that Beelink runs there. With 8 cores and 32 GB of RAM it has plenty of horsepower to run a reverse proxy as well as other services.

So with the background out of the way, let’s look at the hardware I’m using in the next section.

Hardware

In my homelab I currently have three servers, two of which are running individual OpenShift clusters (Home and Hub) and the third is the Beelink (Infra) running infrastructure services. Here are the complete specs for these machines:

Home Cluster Hub Cluster Infra Server
Model Custom Dell 7820 Workstation Beelink SER 6
Processor Ryzen 5950x
16 cores
2 x Xeon 5118
24 cores
Ryzen 7 7735HS
8 cores
Memory 128 GB 160 GB 32 GB
Storage 1 TB nvme (Windows)
1 TB nvme (OpenShift)
1 TB nvme (OpenShift Storage)

256 GB SSD (Arch Linux)
1 256 GB nvme (OpenShift)
2 TB nvme (OpenShift Storage)
512 GB nvme
Storage 2.5 GB (Motherboard)
1 GB (Motherboard)
2.5 GB (PCIe adapter)
1 GB (Motherboard)
2.5 GB (Motherboard)
GPU nVidia 4080 Radeon HD 6450 Radeon iGPU
Software OpenShift OpenShift
Advanced Cluster Manager
Advanced Cluster Security
Arch Linux
HAProxy
Keycloak
GLAuth
Homepage
Pi-hole
Prometheus
Upsnap
Uptime Kuma

Note that the Home server is multi-purpose, during the day it runs OpenShift while at night it’s my gaming machine. Arch Linux on the SSD boots with systemd-boot and let’s me flip between OpenShift and Windows as needed with OpenShift being the default boot option.

The storage on the machines is a mixture of new and used drives hence why some drives are smaller or are SSDs versus nvme drives. Like any good homelabber reuse is a great way to save a few bucks.

I also have a QNAP TS-251D which is a two bay unit with 2 x 4 TB spinning platters, I mostly use this for backups and media files. On an as needed basis I will run a Minio container on it for object storage if needed to support a temporary demo. Having said that this is the part of my homelab I probably regret buying the most, using the cloud for backups would have been sufficient.

Networking

My networking setup is relatively vanilla compared to some of the other homelabbers in Red Hat, networking is not my strong suit so I tend to stick with the minimum that meets my requirements.

It all starts with HAProxy on the infra server routing traffic to the appropriate backend depending on the service that was requested. This routing is managed by using SNI in HAProxy for TLS ports to determine the correct backend and you can see my configuration here.

My homelab is using split DNS where my homelab services can be resolved both externally (i.e. outside my house) and internally (i.e. in my home office). Split DNS means that when I access services from my house I get an internal IP address and when I’m out I get an external IP address. The benefit of this is avoiding the round trip to the Internet when I’m at home plus if your ISP doesn’t let you route traffic back to the router (i.e hairpinning) this can be useful.

To manage this I use pi-hole to provide DNS services in my home as per the diagram below:

network

The external DNS for my homelab is managed through Route 53, this costs approximately $1.50 a month which is very reasonable. Since the IP address of my router is not static and can be changed as needed by my ISP, I use the built-in Asus Dynamic DNS feature. Then in Route 53 I simply set up the DNS for the individual services to use a CNAME record and alias it to the Asus DDNS service which keeps my external IP addresses always up to date without any additional scripting required.

For the internal addresses I have DNSmasq configured on pi-hole to return the local IP addresses instead of the external addresses provided by Route 53. So when I’m home pi-hole resolves my DNS and gives me local addresses, when I’m out and about Route 53 resolves my DNS address and gives me external IP addresses. This setup has been completely seamless and has worked well.

Infrastructure Services

In the hardware section I listed the various infrastructure services I’m running, in this section let’s take a deeper dive to review what I am running and why.

HAProxy. As mentioned in the networking section, it provides the reverse proxy enabling me to expose multiple services to the Internet. For pure http services it also provides TLS termination.

GLAuth. A simple LDAP server that is used to centrally mnanage users and groups in my homelab. While it is functional, in retrospect I wish I had used OpenLDAP however I started with this as my original Infra server, as a test, was a NUC from 2011 and was far less capable then the Beelink. At some point I plan to swap it out for OpenLDAP.

Keycloak. It provides Single Sign-On (SSO) via Open ID Connect to all of the services in my Homelab and connects to GLAuth for identity federation. It also provides SSO with Red Hat’s Google authentication system so if I want to give access to my homelab to a Red Hatter for troubleshooting or testing purposes I can do so.

Homepage. Provides a homepage for my Homelab, is it useful? Not sure but it was a fun configuring it and putting it together. I have it set as my browser home page and there is a certain satisfaction whenever I open my browser and see it.

Homepage

Upsnap. For efficiency reasons I start and stop my OpenShift servers to save on power consumption and help do a tiny bit for the environment. However this means I need a way to easily turn on and off the machines without having to dig under my desk. This is where Upsnap comes into play, it provides a simple UI for wake-on-lan that enables me to easily power up or down my servers as needed.

As a bonus I can VPN into my homelab (this isn’t exposed to the Internet) to manage the power state of my servers remotely.

upsnap

Uptime Kuma. This monitors the health of all of my services and sends alerts to my Slack workspace if any of the services are down. It also monitors for the expiration of TLS certificates and sends me an alert in advance if a certificate will expire soon. It’s very configurable and I was able to tweak it so my OpenShift servers are considered in a maintenance window when I shut them down at night and on weekends.

Uptime-Kuma

Pi-hole. Covered in the network section, this is used to manage my internal DNS in my homelab. It’s also able to do ad blocking but I’ve disabled that as I’ve found it more trouble then it’s worth personally.

pi-hole

Prometheus. A standalone instance of Prometheus, it scrapes metrics for some of my services like Keycloak. At the moment these metrics are only being used in Homepage but I’m planning on getting Grafana installed at some point to support some dashboards.

My infrastructure server is configured using Ansible, you can view the roles I have for it in my homelab-automation repo. A couple of notes on this repo:

  • It’s pretty common that I run roles ad-hoc so you may see the playbook configure-infra-server.yaml constantly change in terms of roles commented out.
  • This repo generates the TLS certificates I need but I haven’t gotten to the point of running it as a cron job. At the moment when uptime-kuma warns me a certificate is about to expire I just run the letsencrypt roles to re-generate and provision the certs on the Infra server. (Note on OpenShift this is all handled automatically by cert-manager)
  • The Keycloak role is a work in progress as fully configuring Keycloak is somewhat involved.

OpenShift

I run two OpenShift clusters using Single Node OpenShift (SNO) as discussed previously. Both clusters are configured and managed through Advanced Cluster Manager (ACM) and OpenShift GitOps (aka Argo CD). While it’s too long to go into details here, I basically have some policies configured in ACM that bootstraps the OpenShift GitOps Operator along with a bootstrap cluster configuration application, using the app-of-app pattern, onto the clusters managed by ACM.

In this GitOps Guide to the Galaxy youtube video I go into a lot of detail of how this works. However note that I’m always iterating and some things have changed since then but it still is good for seeing the big picture.

Once the operator and the Argo CD application are installed on the cluster by ACM, sync waves are used to provision the cluster configuration in an ordered fashion as illustrated by the image below (though the image itself is a bit dated).

cluster-config

Periodically I will temporarily add clusters from the cloud or the internal Red Hat demo system to show specific things to customers, bootstrapping these clusters becomes trivial with ACM using this process.

I run quite a few things on my cluster, here are a few highlights with regard to specific items I use in my clusters:

LVM Storage Operator. This provides dynamic RWO storage to the cluster, it works by managing a storage device (nvme in my case) and partionining it as needed using Logical Volume Manager (LVM). This is a great way to have easy to manage storage in a SNO cluster with minimal resources consumed by the operator.

External Secrets Operator. I use GitOps to manage and configure my clusters and thus need a way to manage secrets securely. I started with Sealed Secrets, which worked well enough, but once I added the second cluster I found it was becoming more of a maintenance burden. Using the External Secrets Operator with the Doppler back-end externalizes all of the secrets and makes it easy to access secrets on either cluster as needed. I wrote a blog on my use of this operator here.

When ACM bootstraps a cluster with the GitOps operator and initial application, it also copies over the secret needed for ESO to access Doppler from the Hub cluster to the target cluster.

Cert Manager. Managing certificates is never fun but the cert-manager operator makes it a trivial exercise. I use this operator with Lets Encrypt to provide certificates for the OpenShift API and wildcard endpoints as well as specific cluster workloads that need a cert.

Advanced Cluster Security (ACS). This is used to provide runtime security on my clusters as it scans images, monitors runtime deployments, etc and is an invaluable tool for managing the security posture of my Homelab. The Hub cluster runs the ACS Central (the user interface) as well as an agent, the Home cluster just runs the agent which connects back to Central on the Hub.

OpenShift Configuration

My OpenShift configuration is spread across a few repos and, well, is involved. As a result it is not possible to do a deep dive on it here however I will list my repos and provide some details in the table below.

Repository Description
cluster-config This repo contains my cluster configuration for the home and hub clusters as well as clusters I may add from AWS and the Red Hat demo system.
acm-hub-bootstrap This is used to bootstrap the ACM Hub cluster, it has a bash script that installs the ACM control plane along with the policies and other components needed to bootstrap and manage other clusters.
cluster-config-pins I use commit pinning to manage promotion between clusters (i.e. rollout change on lab cluster, then non-prod and then prod). This repo is used to hold the pins, it’s a work in progress as I’ve just started doing this but I’m finding it works well for me.
helm-charts This repo holds the various helm charts used in my homelab. One notable chart is the one I use to generate the applications used by the bootstrap app-of-app.

Alerting

I setup a free workspace in Slack and configured it as a destination for all of my alerts from OpenShift as well as other services such as uptime-kuma. Since I use my homelab for customer demos being proactively informed of issues has been really useful.

slack-alerts

Conclusion

This post reviewed my homelab setup, in a somewhat rambling fashion, as of December 2023. If you have any questions, thoughts or ways I could do things better feel free to add a comment to this point.

Bootstrapping Cluster Configuration with RHACM and OpenShift GitOps

Introduction

I’ve been a heavy user of OpenShift GitOps (aka Argo CD) for quite awhile now as you can probably tell from my numerous blog posts. While I run a single cluster day to day to manage my demos and other work I do, I often have the need to spin up other clusters in the public cloud to test or use specific features available in a particular cloud provider.

Bootstrapping OpenShift GitOps into these clusters is always a multi-step affair that involves logging into the cluster, deploying the OpenShift GitOps operator and then finally deploying the cluster configuration App of App for this specific cluster. Wouldn’t it be great if there was a tool out there that could make this easier and help me manage multiple clusters as well? Red Hat Advanced Cluster Manager (RHACM) says hold my beer…

In this article we look at how to use RHACM’s policies to deploy OpenShift GitOps plus the correct cluster configuration across multiple clusters. The relationship between the cluster and the cluster configuration to select will be specified by labeling clusters in RHACM. Cluster labels can be applied whenever you create or import a cluster.


RHACM Cluster Overview

RHACM Cluster Overview


Why RHACM?

One question that may arise in your mind is why use RHACM for this versus using OpenShift GitOps in a hub and spoke model (i.e. an OpenShift GitOps in a central cluster that pushes other OpenShift GitOps instance to other clusters). RHACM provides a couple of compelling benefits here:

1. RHACM uses a pull model rather then a push model. On managed clusters RHACM will deploy an agent that will pull policies and other configuration from the hub cluster, OpenShift GitOps on the other uses a push model where it needs the ability to access the cluster directly. In environments with stricter network segregation and segmentation, which includes a good percentage of my customers, the push model is problematic and often requires jumping through hoops with network security to get firewalls opened.

2. RHACM supports templating in configuration policies. Similar to Helm lookups (which Argo CD doesn’t support at the moment, grrrr), RHACM provides the capability to lookup information from a variety of sources on both the hub and remote clusters. This capability enables us to leverage RHACM’s ability to label clusters to select the specific cluster configuration we want generically.

As a result RHACM makes a compelling case for managing the bootstrap process of OpenShift GitOps.

Bootstrapping OpenShift GitOps

To bootstrap OpenShift GitOps into a managed cluster at a high level we need to create a policy in RHACM that includes ConfigurationPolicy objects to deploy the following:

1. the OpenShift GitOps operator
2. the initial cluster configuration Argo CD Application which in my case is using App of App (or ApplicationSet but more on this below)

A ConfigurationPolicy is simply a way to assert the existence or non-existence of either a complete or partial kubernetes object on one or more clusters. By including a remediationAction of enforce in the ConfigurationPolicy, RHACM will automatically deploy the specified object if it is missing. Hence why I like referring to this capability as “GitOps by Policy”.

For deploying the OpenShift GitOps operator, RHACM has an example policy for this already that you can find in the Stolostron github organization in their policy collection repo here.

In my case I’m deploying my own ArgoCD CustomResource to support some specific resource customizations I need, you can find my version of that policy in my repo here. Note that an ACM Policy can contain many different policy types, thus in my GitOps policy you will see a few different embedded ConfigurationPolicy objects for deploying/managing different Kubernetes objects.

There’s not much need to review these policies in detail as they simply deploy the OLM Subscription required for the OpenShift GitOps operator. However the PlacementRule is interesting since as the name implies this determines which clusters the policy will be placed against. My PlacementRule is as follows:

apiVersion: apps.open-cluster-management.io/v1
kind: PlacementRule
metadata:
  name: placement-policy-gitops
spec:
  clusterConditions:
    - status: "True"
      type: ManagedClusterConditionAvailable
  clusterSelector:
    matchExpressions:
      - { key: gitops, operator: Exists, values: [] }

This placement rule specifies that any cluster that has the label key “gitops” will automatically have the OpenShift GitOps operator deployed on it. In the next policy we will use the value of this “gitops” label to select the cluster configuration to deploy, however before looking at that we need to digress a bit to discuss my repo/folder structure for cluster configuration.

At the moment my cluster configuration is stored in a single cluster-config repository. In this repository there is a folder structure under clusters where I keep a set of overlays that are cluster specific in the /clusters folder, each overlay is named after the cluster.

Within each of those folders is a Helm chart deployed as the bootstrap application that generates a set of applications following Argo’s App of App pattern. This bootstrap application is always stored under each cluster in a specific and identical folder, argocd/bootstrap.

I love kustomize so I am using kustomize to generate output from the Helm chart and then apply any post-patches that are needed, for example from my local.home cluster:

apiVersion: kustomize.config.k8s.io/v1beta1
kind: Kustomization

helmCharts:
- name: argocd-app-of-app
  version: 0.2.0
  repo: https://gnunn-gitops.github.io/helm-charts
  valuesFile: values.yaml
  namespace: openshift-gitops
  releaseName: argocd-app-of-app-0.2.0

resources:
- ../../../default/argocd/bootstrap

patches:
  - target:
      kind: Application
      name: compliance-operator
    patch: |-
      - op: replace
        path: /spec/source/path
        value: 'components/apps/compliance-operator/overlays/scheduled-master'
      - op: replace
        path: /spec/source/repoURL
        value: 'https://github.com/gnunn-gitops/cluster-config'

The reason why post-patches may be needed is that I have a cluster called default that has the common configuration for all clusters (Hmmm, maybe I should rename this to common?). You can see this default configuration referenced under resources in the above example.

Therefore a cluster inheriting from default may need to patch something to support a specific configuration. Patches are typically modifying the repoURL or the path of the Argo CD Application to point to a cluster specific version of the application, typically under the /clusters/<cluster-name>/apps folder. In the example above I am patching the compliance operator to use a configuration that only includes master nodes since my local cluster is a Single-Node OpenShift (SNO) cluster.

You may be wondering why I’m using a Helm chart instead of an ApplicationSet here. While I am very bullish on the future of ApplicationSets at the moment they are lacking three key features I want for this use case:

* No support for sync waves to deploy applications in order, i.e. deploy Sealed-Secrets or cert-manager before other apps that leverage them;
* Insufficient flexibility in templating in terms of being able to dynamically include or exclude chunks of yaml; and
* No integration with the Argo CD UI like you get with App of Apps (primitive though it may be)

For these reasons I’m using a Helm chart to template my cluster configuration instead of ApplicationSets, once these limitations have been addressed I will switch to them in a heartbeat. Continue reading

Integrating OpenShift Pipelines (CI) with GitOps (CD)

Introduction

When organizations adopt GitOps there are many challenges to face such as how do I manage secrets in git, what directory structure should I use for my repos, etc. One of the more vexing challenges is how do I integrate my CI processes with GitOps, aka CD.

A CI pipeline is largely a synchronous process that goes from start to end, i.e. we compile our source code, we build an image, push it out to deployments, run integration tests, etc in a continuous flow. Conversely GitOps follows an event driven flow, a change in git or in cluster state drives the reconciliation process to synchronize the state. As anyone who has worked with messaging systems knows, trying to get synchronous and asynchronous systems working well together can be akin to herding cats and hence why it is a vexing challenge.

In this blog article I will cover the three different approaches that are most often used along with the pros and cons of each approach and the use cases where it makes sense. I will cover some of the implementation details through the lens of OpenShift Pipelines (Tekton) and OpenShift GitOps (Argo CD).

A quick note on terminology, the shorthand acronyms CI (Continuous Integration) and CD (Continuous Deployment) will be used throughout the remainder of this article. CI is referring to pipelines for compiling applications, building images, running integration tests, and more covered by tools like Jenkins, Tekton, Github Actions, etc. When talking about CD we are meaning GitOps tools like Argo CD, Flux or RHACM that are used to deploy applications.

It’s important to keep this distinction in mind since tools like Jenkins are traditionally referred to as CI/CD tools, however when referencing CD here the intent is specifically GitOps tool which Jenkins is not.

Approaches

As mentioned there are three broad approaches typically used to integrate CI with CD.

1. CI Owned and Managed. In this model the CI tool completely owns and manages new deployments on it’s own though GitOps can still manage the provisioning of the manifests. When used with GitOps this approach often uses floating tags (aka dev, test, etc) or has the GitOps tool not track image changes so the CI tool can push new developments without impacting GitOps.

CI Managed

The benefit of this approach is that it continues to follow the traditional CI/CD approach that organizations have gotten comfortable with using tools like Jenkins thus reducing the learning curve. As a result many organizations start with this approach at the earliest stages of their GitOps journey.

The drawback of this model is that it runs counter to the GitOps philosophy that git is the source of truth. With floating tags there is no precision with regards to what image is actually being used at any given moment, if you opt to ignore image references what’s in git is definitely not what’s in the cluster since image references are never updated.

As a result I often see this used in organizations which are new to GitOps and have existing pipelines they want to reuse, it’s essentially step 1 of the GitOps journey for many people.

2. CI Owned, CD Participate’s. Here the CI tool owns and fully manages the deployment of new images but engages the GitOps tool to do the actual deployment, once the GitOps process has completed the CI tool validates the update. From an implementation point of view the CI pipeline will update the manifests, say a Deployment, in git with a new image tag along with a corresponding commit. At this point the pipeline will trigger and monitor the GitOps deployment via APIs in the GitOps tool keeping the entire process managed by the CI pipeline from start to end in a synchronous fashion.

CI Owned, CD Participates

The good part here is that it fully embraces GitOps in the sense that what is in git is what is deployed in the cluster. Another benefit is that it maintains a start-to-end pipeline which keeps the process easy to follow and troubleshoot.

The negative is the additional complexity of integrating the pipeline with the GitOps tool, essentially integrating a synchronous process (CI) with what is inherently an event-driven asynchronous activity (CD) can be challenging. For example, the GitOps tool may already be deploying a change when the CI tool attempts to initiate a new sync and the call fails.

This option makes sense in environments (dev/test) where there are no asynchronous gating requirements (i.e. human approval) and the organization has a desire to fully embrace GitOps.

3. CI Triggered, CD Owned. In this case we have a CI tool that manages the build of the application and image but for deployment it triggers an asynchronous event which will cause the GitOps tool to perform the deployment. This can be done in a variety of ways including a Pull Request (PR) or a fire-and-forget commit in git at which point the CD owns the deployment. Once the CD process has completed the deployment, it can trigger additional pipeline(s) to perform post-deployment tasks such as integration testing, notifications, etc.

CI Triggered, CD Owned

When looking at this approach the benefit is we avoid the messiness of integrating the two tools directly as each plays in their own swimlane. The drawback is the pipeline is no longer a simple start-to-end process but turns into a loosely coupled asynchronous event-driven affair with multiple pipelines chained together which can make troubleshooting more difficult. Additionally, the sync process can happen for reasons unrelated to an updated deployment so chained pipelines need to be able to handle this.

Implementation

In this section we will review how to implement each approach, since I am using Red Hat OpenShift my focus here will be on OpenShift Pipelines (Tekton) and OpenShift GitOps (Argo CD) however the techniques should be broadly applicable to other toolsets. Additionally I am deliberately not looking at tools which fall outside of the purview of Red Hat Supported products. So while tools like Argo Events, Argo Rollouts and Argo Image Updater are very interesting they are not currently supported by Red Hat and thus not covered here.

Throughout the implementation discussion we will be referencing a Product Catalog application. This application is a three tier application, as per the diagram below, that consists of a Node.js single page application (SPA) running in an NGINX container connecting to a Java Quarkus API application which in turn performs CRUD actions against a Maria DB database.

Product Catalog Topology

As a result of this architecture there are separate pipelines for the client and server components but they share many elements. The implementation approaches discussed below are encapsulated in sub pipelines which are invoked as needed by the client and server for reuse. I’ve opted for sub-pipelines in order to better show the logic in demos, but it could just as easily be encapsulated into a custom tekton task.

From a GitOps perspective we have two GitOps instances deployed, a cluster scoped instance and a namespaced scoped instance. The cluster scoped instance is used to configure the cluster as well as resources required by tenants which need cluster-admin rights, things like namespaces, quotas, operators. In this use case the cluster scoped instance deploys the environment namespaces (product-catalog-dev, product-catalog-test and product-catalog-prod) as well as the Product Catalog teams namespaced GitOps instance.

This is being mentioned because you will see references to two different repos and this could be confusing, specifically the following two repos:

1. cluster-config. Managed by the Platform (Ops) team, this is the repo with the manifests deployed by the cluster scoped instance including the product-catalog teams namespaces and gitops instance in the tenants folder.
2. product-catalog. Managed by the application (product-catalog) team, this contains the manifests deployed the namespaced scoped instance. It deploys the actual application and is the manifest containing application image references.

If you are interested in seeing more information about how I organize my GitOps repos you can view my standards document here.

Common Elements

In all three approaches we will need to integrate with git for authentication purposes, in OpenShift Pipelines you can easily integrate a git token with pipelines via a secret as per the docs. The first step is creating the secret and annotating it, below is an example for github:

apiVersion: v1
data:
  email: XXXXXXXXXXXX
  password: XXXXXXXXX
  username: XXXXXXXXX
kind: Secret
metadata:
  annotations:
    tekton.dev/git-0: https://github.com
  name: github
  namespace: product-catalog-cicd
type: kubernetes.io/basic-auth

The second thing we need to do is to link it to the pipeline service account, since this account is created and managed by the Pipelines operator I prefer doing the linking after the fact rather than overwriting it with yaml deployed from git. This is done using a postsync hook in Argo (aka a Job) to make it happen. Below is the basic job, the serviceaccount and role aspects needed to go with this are available here.

apiVersion: batch/v1
kind: Job
metadata:
  name: setup-local-credentials
  annotations:
    argocd.argoproj.io/hook: PostSync
    argocd.argoproj.io/hook-delete-policy: HookSucceeded
spec:
  template:
    spec:
      containers:
      - image: registry.redhat.io/openshift4/ose-cli:v4.9
        command:
          - /bin/bash
          - -c
          - |
            echo "Linking github secret with pipeline service account"
            oc secrets link pipeline github
        imagePullPolicy: Always
        name: setup-local-credentials
      serviceAccount: setup-local-credentials
      serviceAccountName: setup-local-credentials
      dnsPolicy: ClusterFirst
      restartPolicy: OnFailure
      terminationGracePeriodSeconds: 30

CI Owned and Managed

This is the traditional approach that has been around since dinosaurs roamed the earth (T-Rex was a big fan of Hudson), so we will not go into great detail on this but cover some of the OpenShift Pipelines specifics from an implementation point of view.

In OpenShift, or for that matter Kubernetes, the different environments (dev/test/prod) will commonly be in different namespaces. In OpenShift Pipelines it creates a pipeline service account that by default the various pipelines use when running. In order to allow the pipeline to interact with the different environments in their namespaces we need to give the pipeline SA the appropriate role to do so. Here is an example of a Rolebinding in the development environment (product-catalog-dev namespace) giving edit rights to the pipeline service account in the cicd namespace where the pipeline is running.

apiVersion: rbac.authorization.k8s.io/v1
kind: RoleBinding
metadata:
  name: cicd-pipeline-edit
  namespace: product-catalog-dev
roleRef:
  apiGroup: rbac.authorization.k8s.io
  kind: ClusterRole
  name: edit
subjects:
- kind: ServiceAccount
  name: pipeline
  namespace: product-catalog-cicd

This would need to be done for each environment that the pipeline needs to interact with. Also note that I am taking the easy way and using the OOTB edit ClusterRole in OpenShift, more security conciousness organizations may wish to define a Role with more granular permissions.

If you are using floating tags in an enterprise registry (i.e. dev or test) you will need to set the imagePullPolicy to Always to ensure the new image gets deployed on a rollout. At this point a new deployment can be triggered in a task simply by running oc rollout restart.

CI Owned, CD Participate’s

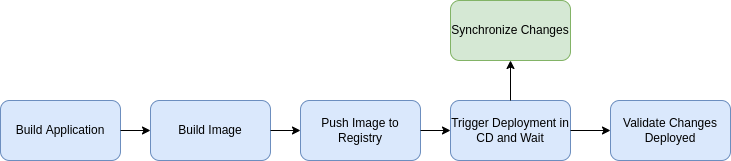
As discussed previously, in this approach the CI pipeline manages the flow from start-to-finish but instead of doing the deployment itself it defers it to CD, aka GitOps. To accomplish this, the pipeline will clone the manifest repo with all of the yaml managed by GitOps, update the image tag for the new image and then commit it back to git. It will then wait for the GitOps tool to perform the deployment and validate the results. This flow is encapsulated in the following pipeline:

This sub-pipeline is invoked by the server and client pipelines via the tkn CLI since we want to trigger this pipeline and wait for it to complete maintaining a synchronous process. Here is an example that calls this pipeline to deploy a new server image in the dev environment:

tkn pipeline start --showlog --use-param-defaults --param application=server --param environment=dev --prefix-name=server-gitops-deploy-dev --param tag=$(tasks.generate-id.results.short-commit)-$(tasks.generate-id.results.build-uid) --workspace name=manifest-source,claimName=manifest-source gitops-deploy

Let’s look at this gitops deployment sub-pipeline in a little more detail for each individual task.

1. acquire-lease. Since this pipeline is called by other pipelines there is a lease which acts as a mutex to ensure only one instance of this pipeline can run at a time. The details are not relevant to this article however for those interested the implementation was based on an article found here.

2. clone. This task clones the manifest yaml files into a workspace to be used in subsequent steps.

3. update-image. There are a variety of ways to update the image reference depending on how you are managing yaml in GitOps. If GitOps is deploying raw yaml, you many need something like yq to patch a deployment. If you are using a helm chart, yq again could help you update the values.yaml. in my case I am using kustomize which has the capability to override the image tag in an overlay with the following command:

kustomize edit set image <image-name>=<new-image>:<new-image-tag>

In this pipeline we have a kustomize task for updating the image reference. It takes parameters to the image name, new image name and tag as well as the path to the kustomize overlay. In my case the overlay is associated with the environment and cluster, you can see an example here for the dev environment in the home cluster.

4. commit-change. Once we have updated the image we need to commit the change back to git using a git task and running the appropriate git commands. In this pipeline the following commands are used:

if git diff --exit-code;
then
  echo "No changes staged, skipping add/commit"
else
  echo "Changes made, committing"
  git config --global user.name "pipeline"
  git config --global user.email "pipelines@nomail.com"
  git add clusters/$(params.cluster)/overlays/$(params.environment)/kustomization.yaml
  git commit -m 'Update image in git to quay.io/gnunn/$(params.application):$(params.tag)'
  echo "Running 'git push origin HEAD:$(params.git_revision)'"
  git push origin HEAD:$(params.git_revision)
fi

One thing to keep in mind is that it is possible for the pipeline to be executed when no code has been changed, for example testing the pipeline with the same image reference. The if statement here exists as a guard for this case.

5. gitops-deploy. This is where you trigger OpenShift GitOps to perform the deployment. In order to accomplish this the pipeline needs to use the argocd CLI to interact with OpenShift GitOps which in turns requires a token before the pipeline runs.

Since we are deploying everything with a cluster level GitOps, including the namespace GitOps that is handling the deployment here, we can have the cluster level GitOps create a local account and then generate a corresponding token for that account in the namespaced GitOps instance. A job running as a PostSync hook does the work here, it checks if the local account already exists and if not creates it along with a token which is stored as a secret in the CICD namespace for the pipeline to consume.

apiVersion: batch/v1
kind: Job
metadata:
  name: create-pipeline-local-user
  annotations:
    argocd.argoproj.io/hook: PostSync
    argocd.argoproj.io/hook-delete-policy: HookSucceeded
spec:
  template:
    spec:
      containers:
      - image: registry.redhat.io/openshift-gitops-1/argocd-rhel8:v1.4.2
        command:
          - /bin/bash
          - -c
          - |
            export HOME=/home/argocd
            echo "Checking if pipeline account already there..."
            HAS_ACCOUNT=$(kubectl get cm argocd-cm -o jsonpath={.data."accounts\.pipeline"})
            if [ -z "$HAS_ACCOUNT" ];
            then
                echo "Pipeline account doesn't exist, adding"
                echo "Getting argocd admin credential..."
                if kubectl get secret argocd-cluster;
                then
                  # Create pipeline user
                  kubectl patch cm argocd-cm --patch '{"data": {"accounts.pipeline": "apiKey"}}'
                  # Update password
                  PASSWORD=$(oc get secret argocd-cluster -o jsonpath="{.data.admin\.password}" | base64 -d)
                  argocd login --plaintext --username admin --password ${PASSWORD} argocd-server
                  TOKEN=$(argocd account generate-token --account pipeline)
                  kubectl create secret generic argocd-env-secret --from-literal=ARGOCD_AUTH_TOKEN=${TOKEN} -n ${CICD_NAMESPACE}
                else
                  echo "Secret argocd-cluster not available, could not interact with API"
                fi
            else
                echo "Pipeline account already added, skipping"
            fi
        env:
        # The CICD namespace where the token needs to be deployed to
        - name: CICD_NAMESPACE
          value: ""
        imagePullPolicy: Always
        name: create-pipeline-local-user
      serviceAccount: argocd-argocd-application-controller
      serviceAccountName: argocd-argocd-application-controller
      dnsPolicy: ClusterFirst
      restartPolicy: OnFailure
      terminationGracePeriodSeconds: 30

Since the argocd-argocd-application-controller already has access to the various namespaces we just reuse it for the job since it needs to create a secret in the product-catalog-cicd namespace, again more security conscious organizations may wish to use more granular permissions.

Finally we also need to give this local account, pipeline, appropriate RBAC permissions in the namespaced GitOps ionstance as well. The following roles are defined in the argocd CR for the namespaced instance:

spec:
  ...
  rbac:
    defaultPolicy: 'role:readonly'
    policy: |
      p, role: pipeline, applications, get, apps-product-catalog/*, allow
      p, role: pipeline, applications, sync, apps-product-catalog/*, allow
      g, product-catalog-admins, role:admin
      g, system:cluster-admins, role:admin
      g, pipeline, role: pipeline
    scopes: '[accounts,groups]'

Once we have the integration in play we can use a task in the pipeline to trigger a sync in GitOps via the argocd CLI. Unfortunately this part can be a bit tricky depending on how you have GitOps configured given it is an asynchronous process and timing issues can occur. For example if you are using webhooks with GitOps it’s quite possible that the deploy is already in progress and trying to trigger it again will fail.

In this pipeline we took the example Argo CD Sync and Wait task in Tekton Hub and modified it to make it somewhat more resilient. The key change was having the task execute argocd app wait first and then validate if the image was already updated before performing an explicit sync. The full task is available here, but here is the portion doing the work:

if [ -z "$ARGOCD_AUTH_TOKEN" ]; then
  yes | argocd login "$ARGOCD_SERVER" --username="$ARGOCD_USERNAME" --password="$ARGOCD_PASSWORD";
fi
# Application may already be syncing due to webhook
echo "Waiting for automatic sync if it was already triggered"
argocd app wait "$(params.application-name)" --health "$(params.flags)"
echo "Checking current tag in namespace $(params.namespace)"
CURRENT_TAG=$(oc get deploy $(params.deployment) -n $(params.namespace) -o jsonpath="{.spec.template.spec.containers[$(params.container)].image}" | cut -d ":" -f2)
if [ "$CURRENT_TAG" = "$(params.image-tag)" ]; then
  echo "Image has been synced, exiting"
  exit 0
fi
echo "Running argocd sync..."
argocd app sync "$(params.application-name)" --revision "$(params.revision)" "$(params.flags)"
argocd app wait "$(params.application-name)" --health "$(params.flags)"
CURRENT_TAG=$(oc get deploy $(params.deployment) -n $(params.namespace) -o jsonpath="{.spec.template.spec.containers[$(params.container)].image}" | cut -d ":" -f2)
if [ "$CURRENT_TAG" = "$(params.image-tag)" ]; then
  echo "Image has been synced"
else
  echo "Image failed to sync, requested tag is $(params.image-tag) but current tag is $CURRENT_TAG"
  exit 1;
fi

Also note that this task validates the required image was deployed and fails the pipeline if it was not deployed for any reason. I suspect this task will likely require some further tuning based on comments in this Argo CD issue.

CI Triggered, CD Owned

As a refresher, in this model the pipeline triggers the deployment operation in GitOps but at that point the pipeline completes with the actual deployment being owned by GitOps. This can be done via a Pull Request (PR), fire-and-forget commit, etc but in the case we will look at this being done by a PR to support gating requirements requiring human approval which is an asynchronous process.

This pipeline does require a secret for GitHub in order to create the PR however we simply reuse the same secret that was provided earlier.

The pipeline that provides this capability in the product-catalog demo is as follows:

This pipeline is invoked by the server and client pipelines via a webhook since we are treating this as an event.

In this pipeline the following steps are performed:

1. clone. Clone the git repo of manifest yaml that GitOps is managing

2. branch. Create a new branch in the git repo to generate the PR from, in the product catalog I use push-<build-id> as the branch identifier.

3. patch. Update the image reference using the same kustomize technique that we did previously.

4. commit. Commit the change and push it in the new branch to the remote repo.

5. prod-pr-deploy. This task creates a pull request in GitHub, the GitHub CLI makes this easy to do:

 gh pr create -t "$(params.title)" -b "$(params.body)"

One thing to note in the pipeline is that it passes in links to all of the gating requirements such as image vulnerabilities in Quay and RHACS as well as static code analysis from Sonarqube.

Once the PR is created the pipeline ends, when the application is sync’ed by Argo CD it runs a post-sync hook Job to start a new pipeline to run the integration tests and send a notification if the tests fail.

apiVersion: batch/v1
kind: Job
metadata:
  name: post-sync-pipeline
  generateName: post-sync-pipeline-
  annotations:
    argocd.argoproj.io/hook: PostSync
    argocd.argoproj.io/hook-delete-policy: HookSucceeded
spec:
  template:
    spec:
      containers:
        - image: registry.access.redhat.com/ubi8
          command:
          - "curl"
          - "-X"
          - "POST"
          - "-H"
          - "Content-Type: application/json"
          - "--data"
          - "{}"
          - "http://el-server-post-prod.product-catalog-cicd:8080"
          imagePullPolicy: Always
          name: post-sync-pipeline
      dnsPolicy: ClusterFirst
      restartPolicy: OnFailure
      terminationGracePeriodSeconds: 30

Conclusion

We reviewed the three different approaches to integrating OpenShift Pipelines and OpenShift GitOps and then examined a concrete implementation of each approach.

Managing OpenShift Pipelines Configuration with GitOps

OpenShift Pipelines enables you to manage the configuration of the operator via a global TektonConfig object called config. In this blog entry we will look at how to use GitOps to manage this object but first a bit of background about the use case where I need to do this.

In OpenShift Pipelines 1.6 in OpenShift 4.9 the ability to control the scope of the when statement in tekton with respect to whether the task or the task and it’s dependant chain of tasks was skipped. Previous to this release, the setting could not be changed and was set to skip the task and it’s dependant tasks. This meant you could not use the when statement if you only wanted to skip a specific task which greatly limited the usefullness of when in my humble opinion.

Thus I was super excited with the 1.6 release to be able to control this setting via the scope-when-expressions-to-task configuration variable. More details on this configutation setting can be found in the tekton documentation here.

One complication with the global config object is that it is created and managed by the operator. While you could potentially have GitOps overwrite the configuration with your version you need to be cognizant that the newer versions of Pipelines could add new configuration settings which would be overwritten by your copy in git and thereby cause compatibility issues. You could certainly deal with it by checking the generated “config” object on operator upgrades and update your copy accordingly but I prefer to use a patching strategy to make it more fire and forget.

As a result, we can use our trusty Kubernetes job to patch this config object as needed. To patch this particular setting, a simple “oc patch” command will suffice as follows:

oc patch TektonConfig config --type='json' -p='[{"op": "replace", "path": "/spec/pipeline/scope-when-expressions-to-task", "value":true}]'

Wrapping this in a job is similarly straightforward:

apiVersion: batch/v1
kind: Job
metadata:
  name: patch-tekton-config-parameters
  namespace: openshift-operators
  annotations:
    argocd.argoproj.io/hook: PostSync
    argocd.argoproj.io/hook-delete-policy: HookSucceeded
spec:
  template:
    spec:
      containers:
        - image: registry.redhat.io/openshift4/ose-cli:v4.9
          command:
            - /bin/bash
            - -c
            - |
              echo "Waiting for TektonConfig config to be present"
              until oc get TektonConfig config -n openshift-operators
              do
                sleep $SLEEP;
              done
 
              echo "Patching TektonConfig config patameters"
              oc patch TektonConfig config --type='json' -p='[{"op": "replace", "path": "/spec/pipeline/scope-when-expressions-to-task", "value":true}]'
          imagePullPolicy: Always
          name: patch-tekton-config-parameters
          env:
            - name: SLEEP
              value: "5"
      dnsPolicy: ClusterFirst
      restartPolicy: OnFailure
      terminationGracePeriodSeconds: 30
      serviceAccount: patch-tekton-config-parameters
      serviceAccountName: patch-tekton-config-parameters

A couple of items to note in this job. Since I’m deploying this job with the operator itself I have the job wait until the TektonConfig object is available though I should probably improve this to limit how long it waits since it currently waits forever.

Second notice that I’m using a separate serviceaccount patch-tekton-config-parameters for this job, this is so I can tailor the permissions to just those needed to patch the TektonConfig object as per below:

apiVersion: v1
kind: ServiceAccount
metadata:
  name: patch-tekton-config-parameters
  namespace: openshift-operators
---
apiVersion: rbac.authorization.k8s.io/v1
kind: ClusterRole
metadata:
  name: patch-tekton-config-parameters
rules:
  - apiGroups:
      - operator.tekton.dev
    resources:
      - tektonconfigs
    verbs:
      - get
      - list
      - patch
---
apiVersion: rbac.authorization.k8s.io/v1
kind: ClusterRoleBinding
metadata:
  name: patch-tekton-config-parameters
roleRef:
  apiGroup: rbac.authorization.k8s.io
  kind: ClusterRole
  name: patch-tekton-config-parameters
subjects:
  - kind: ServiceAccount
    name: patch-tekton-config-parameters
    namespace: openshift-operators

A complete example is in my cluster-config repository.

Integrating RHACS with OpenShift Authentication in GitOps

Further to my previous post about deploying Red Hat Advanced Cluster Security (RHACS) via GitOps, the newest version of RHACS enables direct integration with OpenShift OAuth. This addition means that it is no longer required to use RH-SSO to integrate with OpenShift authentication which greatly simplifies the configuration.

To configure RHACS to use this feature in GitOps, we can craft a simple kubernetes job to leverage the ACS REST API to push the configuration into RHACS once Central is up and running. This job can be found here in my cluster-config repo but also is shown below:

apiVersion: batch/v1
kind: Job
metadata:
  annotations:
    argocd.argoproj.io/sync-wave: "10"
  name: create-oauth-auth-provider
  namespace: stackrox
spec:
  template:
    spec:
      containers:
        - image: image-registry.openshift-image-registry.svc:5000/openshift/cli:latest
          env:
          - name: PASSWORD
            valueFrom:
              secretKeyRef:
                name: central-htpasswd
                key: password
          - name: DEFAULT_ROLE
            value: Admin
          - name: UI_ENDPOINT
            value: central-stackrox.apps.home.ocplab.com
          command:
            - /bin/bash
            - -c
            - |
              #!/usr/bin/env bash
              # Wait for central to be ready
              attempt_counter=0
              max_attempts=20
              echo "Waiting for central to be available..."
              until $(curl -k --output /dev/null --silent --head --fail https://central); do
                  if [ ${attempt_counter} -eq ${max_attempts} ];then
                    echo "Max attempts reached"
                    exit 1
                  fi
                  printf '.'
                  attempt_counter=$(($attempt_counter+1))
                  echo "Made attempt $attempt_counter, waiting..."
                  sleep 5
              done
              echo "Configuring OpenShift OAuth Provider"
              echo "Test if OpenShift OAuth Provider already exists"
              response=$(curl -k -u "admin:$PASSWORD" https://central/v1/authProviders?name=OpenShift | python3 -c "import sys, json; print(json.load(sys.stdin)['authProviders'], end = '')")
              if [[ "$response" != "[]" ]] ; then
                echo "OpenShift Provider already exists, exiting"
                exit 0
              fi
              export DATA='{"name":"OpenShift","type":"openshift","active":true,"uiEndpoint":"'${UI_ENDPOINT}'","enabled":true}'
              echo "Posting data: ${DATA}"
              authid=$(curl -k -X POST -u "admin:$PASSWORD" -H "Content-Type: application/json" --data $DATA https://central/v1/authProviders | python3 -c "import sys, json; print(json.load(sys.stdin)['id'], end = '')")
              echo "Authentication Provider created with id ${authid}"
              echo "Updating minimum role to ${DEFAULT_ROLE}"
              export DATA='{"previous_groups":[],"required_groups":[{"props":{"authProviderId":"'${authid}'"},"roleName":"'${DEFAULT_ROLE}'"}]}'
              curl -k -X POST -u "admin:$PASSWORD" -H "Content-Type: application/json" --data $DATA https://central/v1/groupsbatch
          imagePullPolicy: Always
          name: create-oauth-auth-provider
      dnsPolicy: ClusterFirst
      restartPolicy: Never
      serviceAccount: create-cluster-init
      serviceAccountName: create-cluster-init
      terminationGracePeriodSeconds: 30

The job will wait for Central to be available so it can be deployed simultaneously with the operator as per my last article. Also while you could optionally run this as a post-sync hook in Argo CD, however since this job is something that only needs to be run once I’ve opted to not annotate it with the post sync hook.

Enabling metrics in RH-SSO

Red Hat’s productized version of Keycloak is Red Hat Single Sign-On (RH-SSO), if you are not familair with Keycloak it is a popular open source identity and access management project. RH-SSO is a core base of application infrastructure at many organizations and monitoring it effectively is critical to ensuring service goals are being met.

Out of the box, the RH-SSO 7.4 image exposes Prometheus metrics however these metrics are for the underlying JBoss EAP platform that RH-SSO is running on rather than Keycloak specific metrics. While these low level JBoss EAP metrics are very useful and we definitely want to capture them, wouldn’t it be great if we could get highler level metrics on the number of logins, failed logins, client logins, etc from Keycloak as well?

This is where the community Aerogear Keycloak Metrics SPI project comes in play, it is a Keycloak extension that provides these metrics by leveraging the Keycloak eventing capabilities. Using this extension with RH-SSO, while not directly supported by Red Hat, is easy and straightforward. Note that this article was written using RH-SSO 7.4, your mileage may vary on other versions but conceptually it should follow the same process.

The first order of business is to create a container image that deploys the aerogear extension, here is the Containerfile that I am using:

FROM registry.redhat.io/rh-sso-7/sso74-openshift-rhel8:latest
 
ARG aerogear_version=2.5.0
 
RUN cd /opt/eap/standalone/deployments && \
    curl -LO https://github.com/aerogear/keycloak-metrics-spi/releases/download/${aerogear_version}/keycloak-metrics-spi-${aerogear_version}.jar && \
    touch keycloak-metrics-spi-${aerogear_version}.jar.dodeploy && \
    cd -

This container file is referencing the default rh-sso image from Red Hat and then downloading and installing the Aerogear SPI extension. I expect that many organizations using RH-SSO likely have already created their own image already to support themes and other extensions. You can either put your own image in the FROM block or simply incorporate the above into your own Containerfile. Once you have created the custom image you can deploy it into your OpenShift cluster.

NOTE. Currently this metrics SPI exposes the keycloak metrics on the default https port with no authentication which is a significant security concern as documented here. There is a pull request (PR) in progress to mitigate this in OpenShift here, I will update this blog once the PR is merged.

One other thing that needs to be done as part of the deployment is expose the EAP metrics because we want to capture them as well. By default the RH-SSO exposes the metrics on the management port which only binds to localhost thereby preventing Prometheus from scraping them. In order to enable Prometheus to scrape these metrics you will need to bind the management port to all IP addresses (0.0.0.0) so it can be read from the Pod IP. To do this, add -Djboss.bind.address.management=0.0.0.0 to the existing JAVA_OPTS_APPEND environment variable for the Deployment or StatefulSet you are using to deploy RH-SSO. If it doesn’t exist, just add it.

Once the SPI is deployed you then need to configure the realms you want to monitor to route events to the metrics-listener. To do this go to Manage > Events > Config and make the change in Event Listeners as per the screenshot below, be careful not to delete existing listeners.

This needs to be done on every realm for which you want to track metrics.

Once you have the SPI deployed and added the event listener to the realms to be monitored you are now ready to validate that it is working. The SPI works by adding a /metrics at the end of each realm URL. For example to view the metrics from the master realm, you would use the path /auth/realms/master/metrics. To test the metrics RSH to one of the SSO pods and run the following two curl commands:

# Test keycloak metrics for master realm on pod IP
$ curl -k https://$(hostname -i):8443/auth/realms/master/metrics
 
# HELP keycloak_user_event_CLIENT_REGISTER_ERROR Generic KeyCloak User event
# TYPE keycloak_user_event_CLIENT_REGISTER_ERROR counter
# HELP keycloak_user_event_INTROSPECT_TOKEN Generic KeyCloak User event
...
 
# Test EAP metrics on pod IP
curl http://$(hostname -i):9990/metrics
 
# HELP base_cpu_processCpuLoad Displays the "recent cpu usage" for the Java Virtual Machine process.
# TYPE base_cpu_processCpuLoad gauge
base_cpu_processCpuLoad 0.009113504556752278
...

If everything worked you should see a lot of output after the each curl commands with the first few lines being similar to the outputs shown. Now comes the next step, having prometheus scrape this data. In this blog I am using OpenShift’s User Workload monitoring feature that I blogged about here so I will not go into the intricacies of setting up the prometheus operator again.

To configure scraping of the EAP metrics we define a PodMonitor since this port isn’t typically defined in the SSO service, for my deployment the pod monitor appears as follows:

apiVersion: monitoring.coreos.com/v1
kind: PodMonitor
metadata:
  name: eap
spec:
  selector:
    matchLabels:
      app: sso
  podMetricsEndpoints:
  - targetPort: 9990

Note that my deployment of sso has the pods labelled app: sso, make sure to update the selector above to match on a label in your sso pods. After that we define a servicemonitor to scrape the Aerogear Keycloak SPI metrics:

apiVersion: monitoring.coreos.com/v1
kind: ServiceMonitor
metadata:
  name: keycloak
spec:
  jobLabel: keycloak
  selector:
    matchLabels:
      app: sso
  endpoints:
  - port: keycloak
    path: /auth/realms/master/metrics
    scheme: https
    tlsConfig:
      insecureSkipVerify: true
    relabelings:
    - targetLabel: job
      replacement: keycloak
    - targetLabel: provider
      replacement: keycloak
    - targetLabel: instance
      replacement: sso
  - port: keycloak
    path: /auth/realms/openshift/metrics
    scheme: https
    tlsConfig:
      insecureSkipVerify: true
    relabelings:
    - targetLabel: job
      replacement: keycloak
    - targetLabel: provider
      replacement: keycloak
    - targetLabel: instance
      replacement: sso
  - port: keycloak
    path: /auth/realms/3scale/metrics
    scheme: https
    tlsConfig:
      insecureSkipVerify: true
    relabelings:
    - targetLabel: job
      replacement: keycloak
    - targetLabel: provider
      replacement: keycloak
    - targetLabel: instance
      replacement: sso

A couple of items to note here, first be aware that each realm’s metrics are on a separate path so multiple endpoints must be defined, one per realm. Second my SSO deployment is set to re-encrypt and is using a self-signed certificate at the service level. As a result we need to set insecureSkipVerify to true otherwise Prometheus will not scrape it due to an invalid certificate. Similar to the PodMonitor, update the selector to match labels in your service.

I’m using relabelings to set various labels that will appear with the metrics. This is needed because the Grafana dashboard I am using from the grafana library expects certain labels like job and provider to be set to keycloak otherwise it’s queries will not find the metrics. Setting these labels here is easier then modifying the dashboard. Finally I set the instance label to sso, if you don’t set this the instance label will default to the IP and port so this is a friendlier way of presenting it.

At this point we can deploy some grafana dashboards. Again I covered deploying and connecting Grafana to the cluster monitoring in a previous article so will not be covering it again. To deploy the keycloak dashboard we can reference the existing one in the grafana library in a dashboard object as follows:

apiVersion: integreatly.org/v1alpha1
kind: GrafanaDashboard
metadata:
  name: sso-dashboard
  labels:
    app: grafana
spec:
  url: https://grafana.com/api/dashboards/10441/revisions/1/download
  datasources:
  - inputName: "DS_PROMETHEUS"
    datasourceName: "Prometheus"
  plugins:
    - name: grafana-piechart-panel
      version: 1.3.9

When rendered the dashboard appears as follows, note that my environment is not loaded so it’s not quite as interesting as it would be in a real production environment.

Keycloak Dashboard

Keycloak Dashboard

You can see that various metrics around heap, logins, login failures as well as other statistics are presented making it easier to understand what is happening with your SSO installation at any given time.

Next we do the same thing to create an EAP dashboard so we can visualize the EAP metrics:

apiVersion: integreatly.org/v1alpha1
kind: GrafanaDashboard
metadata:
  name: eap-dashboard
  labels:
    app: grafana
spec:
  url: https://grafana.com/api/dashboards/10313/revisions/1/download
  datasources:
  - inputName: "DS_PROMETHEUS"
    datasourceName: "Prometheus"

And here is the EAP dashboard in all it’s glory:

JBoss EAP Dashboard

JBoss EAP Dashboard

The dashboard displays detailed metrics on the JVM heap status but you can also monitor other EAP platform components like databases and caches by customizing the dashboard. One of the benefits of Grafana is that it enables you to design dashboards that makes the most sense for your specific use case and organization. You can start with an off-the-shelf dashboard and then modify it as needed to get the visualization that is required.

RH-SSO is a key infrastructure component for many organizations and monitoring it effectively is important to ensure that SLAs and performance expectations are being met. Hopefully this article will provide a starting point for your organization to define and create a monitoring strategy around RH-SSO.

GitOps and OpenShift Operators Best Practices

In OpenShift, Operators are typically installed through the Operator Lifecycle Manager (OLM) which provides a great user interface and experience. Unfortunately OLM was really designed around a UI experience and as a result when moving to a GitOps approach there are a few things to be aware of in order to get the best outcomes. The purpose of this blog is to outline a handful of best practices that we’ve found after doing this for awhile, so without further ado here is the list:

1. Omit startingCSV in Subscriptions

When bringing an operator into GitOps, it’s pretty common to install an operator manually and then extract the yaml for the subscription and push it into a git repo. This will often appear as per this example:

apiVersion: operators.coreos.com/v1alpha1
kind: Subscription
metadata:
  labels:
    operators.coreos.com/amq7-cert-manager-operator.openshift-operators: ""
  name: amq7-cert-manager-operator
  namespace: openshift-operators
spec:
  channel: 1.x
  installPlanApproval: Automatic
  name: amq7-cert-manager-operator
  source: redhat-operators
  sourceNamespace: openshift-marketplace
  startingCSV: amq7-cert-manager.v1.0.1

OLM will automatically populate the startingCSV for you which represents the specific version of the operator that you want to install. The problem with this is that operator versions will change regularly with updates meaning that everytime it changes you will need to update the version in the git repo. The majority of the time we simply want to consume the latest and greatest operator, omitting the startingCSV accomplishes that goal and greatly reduces the maintenance required for the subscription yaml.

Of course if you have a requirement to install a very specific version of the operator by all means include it, however in my experience this requirement tends to be rare.

2. Create OperatorGroup with namespaces

An OperatorGroup to quote the documentation “provides multitenant configuration to OLM-installed Operators”. Everytime you install an operator there must be one and only one OperatorGroup in the namespace. Some default namespaces, like openshift-operators, will have an OperatorGroup out of the box and you do not need to create a new one from GitOps. However if you want to install operators into your own namespaces you will need to have an OperatorGroup.

When using kustomize there is a temptation to bundle the OperatorGroup with a Subscription. This should be avoided because if you want to install multiple operators, say Prometheus and Grafana, in the same namespace they will create multiple OperatorGroups and prevent the operators from installing.

As a result if I need to install operators in GitOps I much prefer creating the OperatorGroup as part of the same kustomize folder where I’m creating the namespace. This allows me to aggregate multiple operators across different bases without getting into OperatorGroup confusion.

3. Omit the olm.providedAPIs annotation in OperatorGroup

Similar to startingCSV, when manually installing operators you will notice that OLM populates an annotation called olm.providedAPIs. Since OLM will populate it automatically there is no need to include this in the yaml in git as it becomes one more element that you will need to maintain.

4. Prefer manual installation mode

When installing an operator via OLM you can choose to install it in manual or automatic mode. For production clusters you should prefer the manual installation mode in order to control when operator upgrades happen. Unfortunately when using manual mode OLM requires you to approve the initial installation of the operator. While this is easy to do in the console UI it’s a little more challenging with a GitOps tool.

Fortunately my colleague Andrew Pitt has you covered and wrote an excellent tool to handle this, installplan-approver. This is a kubernetes job that you can deploy alongside the operator Subscription that watches for the installplan that OLM creates and automatically approves it. This gives you the desired workflow of automatic installation but manual approvals of upgrades.

Since this is run as a kubernetes job it only runs once and will not accidentally approve upgrades. In other words, subsequent synchronizations from a GitOps tool like Argo CD will not cause the job to run again since from the GitOps tool perspective the job aleeady exists and is synchronized.

5. Checkout the operators already available in Red Hat COP gitops-catalog

Instead of re-inventing a wheel, check out the operators that have already been made available for GitOps in the Red Hat Community of Practice (COP) gitops-catalog. This catalog has a number of commonly used operators already available for use with OpenShift Gitops (OpenShift Pipelines, OpenShift GitOps, Service Mesh, Logging and more). While this catalog is not officially supported by Red Hat, it provides a starting point for you to create your own in-house catalog and benefiting from the work of others.

Well that’s it for now, if you have more best practices feel free to add them in the comments.

Deploying Red Hat Advanced Cluster Security (aka Stackrox) with GitOps

I’ve been running Red Hat Advanced Cluster Security (RHACS) in my personal cluster via the stackrox helm chart for quite awhile, however now that the RHACS operator is available I figured it was time to step up my game and integrate it into my gitops cluster configuration instead of deploying it manually.

Broadly speaking when installing RHACS manually on a cluster there are four steps that you typically need to do:

  1. Subscribe the operator into your cluster via Operator Hub into the stackrox namespace
  2. Deploy an instance of Central which provides the UI, dashboards, etc (i.e. the single pane of glass) to interact with the product using the Central CRD API
  3. Create and download a cluster-init bundle in Central for the sensors and deploy it into the stackrox namespace
  4. Deploy the sensors via the SecuredCluster

When looking at these steps there are a couple of challenges to overcome for the process to be done via GitOps:

  • The steps need to happen sequentially, in particular the cluster-init bundle needs to be deployed before the SecuredCluster
  • Retrieving the cluster-init bundle requires interacting with the Central API as it is not managed via a kubernetes CRD

Fortunately both of these challenges are easily overcome. For the first challenge we can leverage Sync Waves in Argo CD to deploy items in a defined order. To do this, we simply annotate the objects with the desired order, aka wave, that we want using argocd.argoproj.io/sync-wave. For example, here is the operator subscription which goes first as we defined it in wave ‘0’:


apiVersion: operators.coreos.com/v1alpha1
kind: Subscription
metadata:
  annotations:
    argocd.argoproj.io/sync-wave: "0"
  labels:
    operators.coreos.com/rhacs-operator.openshift-operators: ''
  name: rhacs-operator
  namespace: openshift-operators
spec:
  channel: latest
  installPlanApproval: Automatic
  name: rhacs-operator
  source: redhat-operators
  sourceNamespace: openshift-marketplace
  startingCSV: rhacs-operator.v3.62.0

The second challenge, retrieving the cluster-init bundle, is straightforward using the RHACS Central API. To invoke the API we create a small Kubernetes job that Argo CD will deploy after Central is up and running but before the SecuredCluster. The job will use a ServiceAccount with just enough permissions to retrieve the password and then interact with the API, an abbreviated version of the job highlighting the meat of it appears below:

echo "Configuring cluster-init bundle"
export DATA={\"name\":\"local-cluster\"}
curl -k -o /tmp/bundle.json -X POST -u "admin:$PASSWORD" -H "Content-Type: application/json" --data $DATA https://central/v1/cluster-init/init-bundles
echo "Bundle received"
 
echo "Applying bundle"
# No jq in container, python to the rescue
cat /tmp/bundle.json | python3 -c "import sys, json; print(json.load(sys.stdin)['kubectlBundle'])" | base64 -d | oc apply -f -

The last thing that needs to happen to make this work is define a custom health check in Argo CD for Central. If we do not have this healthcheck Argo CD will not wait for Central to be fully deployed before moving on to the next item in the wave which will cause issues when the job tries to execute and no Central is available. In your argo CD resource customization you need to add the following:

    platform.stackrox.io/Central:
      health.lua: |
        hs = {}
        if obj.status ~= nil and obj.status.conditions ~= nil then
            for i, condition in ipairs(obj.status.conditions) do
              if condition.status == "True" and condition.reason == "InstallSuccessful" then
                  hs.status = "Healthy"
                  hs.message = condition.message
                  return hs
              end
            end
        end
        hs.status = "Progressing"
        hs.message = "Waiting for Central to deploy."
        return hs

A full example of the healthcheck is in the repo I use to install the OpenShift GitOps operator here.

At this point you should have a fully functional RHACS deployment in your cluster being managed by the OpenShift GitOps operator (Argo CD). Going further, you can extend the example by using the Central API to integrate with RH-SSO and other components in your infrastructure using the same job technique to fetch the cluster-init-bundle.

The complete example of this approach is available in the Red Hat Canada GitOps Catalog repo in the acs-operator folder.

Discovering OpenShift Resources in Quarkus

I have a product-catalog application that I have been using as a demo for awhile now, it’s essentially a three tier application as per the topology view below with the front-end (client) using React, the back-end (server) written in Quarkus and a Maria database.

The client application is a Single Page Application (SPA) using React that talks directly to the server application via REST API calls. As a result, the Quarkus server back-end needs to have CORS configured in order to accept requests from the front-end application. While a wildcard, i.e. ‘*’, certainly works, in cases where it’s not a public API I prefer a more restrictive setting for CORS, i.e. http://client-product-catalog-dev.apps.home.ocplab.com.

The downside of this restrictive approach is that I need to customize this CORS setting on every namespace and cluster I deploy the application into since the client route is unique in each of those cases. While tools like kustomize or helm can help with this, the client URL needed for the CORS configuration is already defined as a route in OpenShift so why not just have the application discover the URL at runtime via the kubernetes API?

This was my first stab at using the openshift-client in Quarkus and it was surprisingly easy to get going. The Quarkus guide on using the kubernetes/openshift client is excellent as is par for the course with Quarkus guides. Folowing the guide, the first step is adding the extension to your pom.xml:

./mvnw quarkus:add-extension -Dextensions="openshift-client"

After that it’s just a matter of writing some code to discover the route. I opted to label the route with endpoint:client and to search for the route by that label. The first step was to create a LabelSelector as follows:

LabelSelector selector = new LabelSelectorBuilder().withMatchLabels(Map.ofEntries(entry("endpoint", "client"))).build();

Now that we have the label selector we can then ask for a list of routes matching that selector:

List<Route> routes = openshiftClient.routes().withLabelSelector(selector).list().getItems();

Finally with the list of routes I opt to use the first match. Note for simplicity I’m omitting a bunch of checking and logging that I am doing if there are zero matches or multiple matches, the full class with all of those checks appears further below.

Route route = routes.get(0);
String host = route.getSpec().getHost();
boolean tls = false;
if (route.getSpec().getTls() != null && "".equals(route.getSpec().getTls().getTermination())) {
    tls = true;
}
String corsOrigin = (tls?"https":"http") + "://" + host;

Once we have our corsOrigin, we set it as a system property to override the default setting:

System.setProperty("quarkus.http.cors.origins", corsOrigin);

In OpenShift you will need to give the view role to the serviceaccount that is running the pod in order for it to be able to interact with the Kubernetes API. This can be done via the CLI as follows:

oc adm policy add-role-to-user view -z default

Alternatively if using a kustomize or GitOps the equivalent yaml would be as follows:

apiVersion: rbac.authorization.k8s.io/v1
kind: RoleBinding
metadata:
  name: default-view
roleRef:
  apiGroup: rbac.authorization.k8s.io
  kind: ClusterRole
  name: view
subjects:
- kind: ServiceAccount
  name: default

So that’s basically it, with a little bit of code I’ve reduced the amount of configuration that needs to be done to deploy the app on a per namespace/cluster basis. The complete code is below appears below.

package com.redhat.demo;
 
import java.util.Map;
import static java.util.Map.entry;
 
import java.util.List;
 
import javax.enterprise.context.ApplicationScoped;
import javax.enterprise.event.Observes;
import javax.inject.Inject;
 
import io.fabric8.kubernetes.api.model.LabelSelector;
import io.fabric8.kubernetes.api.model.LabelSelectorBuilder;
import io.fabric8.openshift.api.model.Route;
import io.fabric8.openshift.client.OpenShiftClient;
import io.quarkus.runtime.ShutdownEvent;
import io.quarkus.runtime.StartupEvent;
 
import org.eclipse.microprofile.config.ConfigProvider;
import org.jboss.logging.Logger;
 
@ApplicationScoped
public class OpenShiftSettings {
 
    private static final Logger LOGGER = Logger.getLogger("ListenerBean");
 
    @Inject
    OpenShiftClient openshiftClient;
 
    void onStart(@Observes StartupEvent ev) {
        // Test if we are running in a pod
        String k8sSvcHost = System.getenv("KUBERNETES_SERVICE_HOST");
        if (k8sSvcHost == null || "".equals(k8sSvcHost)) {
            LOGGER.infof("Not running in kubernetes, using CORS_ORIGIN environment '%s' variable",
                    ConfigProvider.getConfig().getValue("quarkus.http.cors.origins", String.class));
            return;
        }
 
        if (System.getenv("CORS_ORIGIN") != null) {
            LOGGER.infof("CORS_ORIGIN explicitly defined bypassing route lookup");
            return;
        }
 
        // Look for route with label endpoint:client
        if (openshiftClient.getMasterUrl() == null) {
            LOGGER.info("Kubernetes context is not available");
        } else {
            LOGGER.infof("Application is running in OpenShift %s, checking for labelled route",
                    openshiftClient.getMasterUrl());
 
            LabelSelector selector = new LabelSelectorBuilder()
                    .withMatchLabels(Map.ofEntries(entry("endpoint", "client"))).build();
            List<Route> routes = null;
            try {
                routes = openshiftClient.routes().withLabelSelector(selector).list().getItems();
            } catch (Exception e) {
                LOGGER.info("Unexpected error occurred retrieving routes, using environment variable CORS_ORIGIN", e);
                return;
            }
            if (routes == null || routes.size() == 0) {
                LOGGER.info("No routes found with label 'endpoint:client', using environment variable CORS_ORIGIN");
                return;
            } else if (routes.size() > 1) {
                LOGGER.warn("More then one route found with 'endpoint:client', using first one");
            }
 
            Route route = routes.get(0);
            String host = route.getSpec().getHost();
            boolean tls = false;
            if (route.getSpec().getTls() != null && "".equals(route.getSpec().getTls().getTermination())) {
                tls = true;
            }
            String corsOrigin = (tls ? "https" : "http") + "://" + host;
            System.setProperty("quarkus.http.cors.origins", corsOrigin);
        }
        LOGGER.infof("Using host %s for cors origin",
                ConfigProvider.getConfig().getValue("quarkus.http.cors.origins", String.class));
    }
 
    void onStop(@Observes ShutdownEvent ev) {
        LOGGER.info("The application is stopping...");
    }
}

This code is also in my public repository.